In this report, we present a comprehensive analysis of Bahamas vacation home rental trends for the period of July 2022 to July 2023. Key metrics are examined to provide valuable insights for stakeholders in the travel and hospitality industry.
Average Length of Stay (Days) by Month
We shall begin with a depiction of the average length of stay (in days) by month, for inquiries made during the travel period of interest.
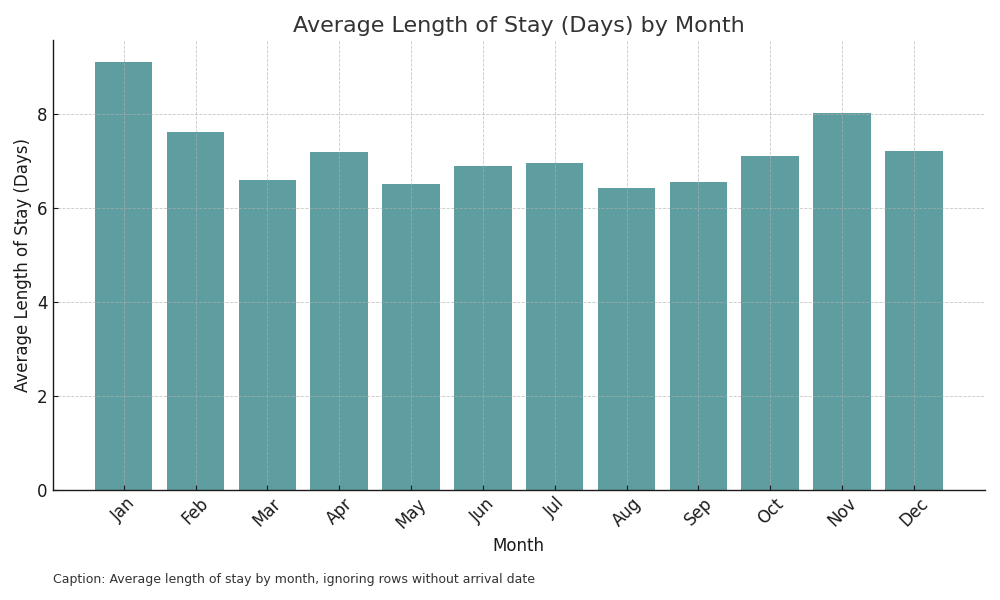
The graph presented above delineates the average length of stay (in days) by month, for vacation rental homes in the Bahamas, allowing stakeholders to gauge the variations in stay duration across different months. A relatively consistent pattern is observed.
This data provides valuable insights for executives in the travel industry to strategize accommodations, pricing, and promotional activities to cater to different travel seasons.
Distribution of Length of Stay
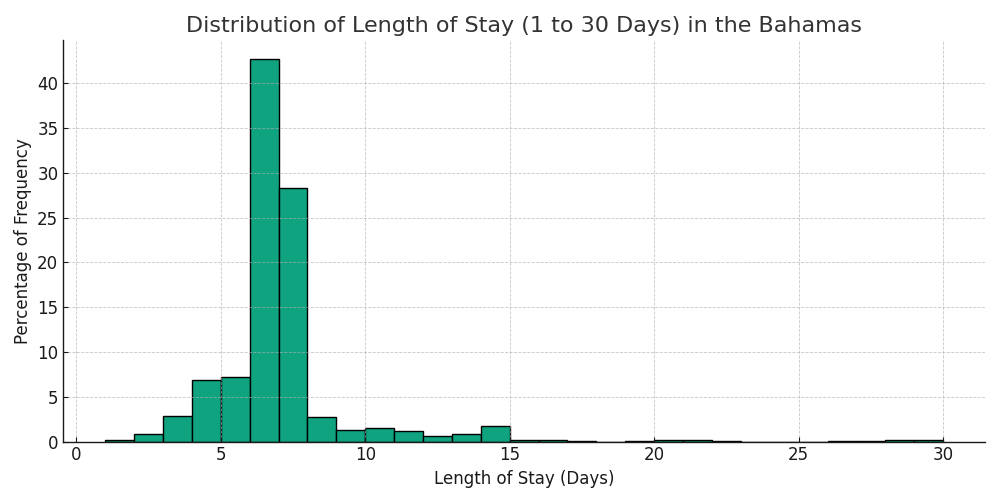
The histogram above represents the distribution of the length of stay (in days) for vacation rentals in the Bahamas, specifically focusing on stays between 1 and 30 days.
This normalized view of the common stay durations within this specific range offers a proportionate understanding of traveler preferences. By representing the frequency as a percentage, stakeholders can gauge the relative significance of different stay lengths.
This insight is essential for strategic alignment with traveler preferences, enabling the design of targeted offerings, pricing structures, and guest experiences.
Average Days from Inquiry to Arrival by Month
The next graph will illustrate the average number of days from inquiry to arrival by month. This metric provides insights into how far in advance travelers are planning their trips.
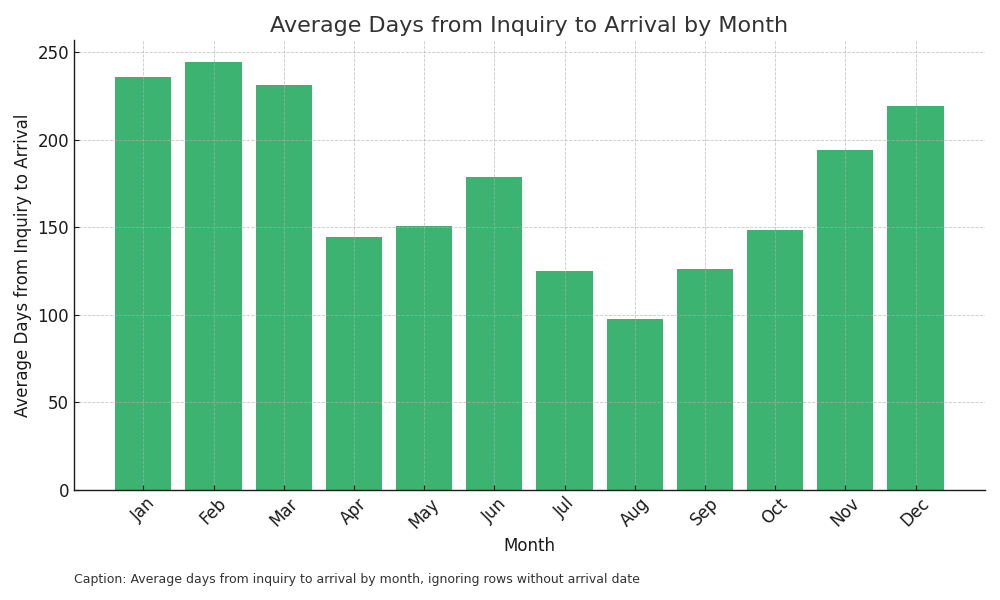
Understanding these trends is vital for stakeholders in the travel and hospitality industry. It allows for the alignment of marketing campaigns, promotional activities, and inventory management to meet the specific needs and behaviors of travelers during different seasons.
Average Group Size by Month
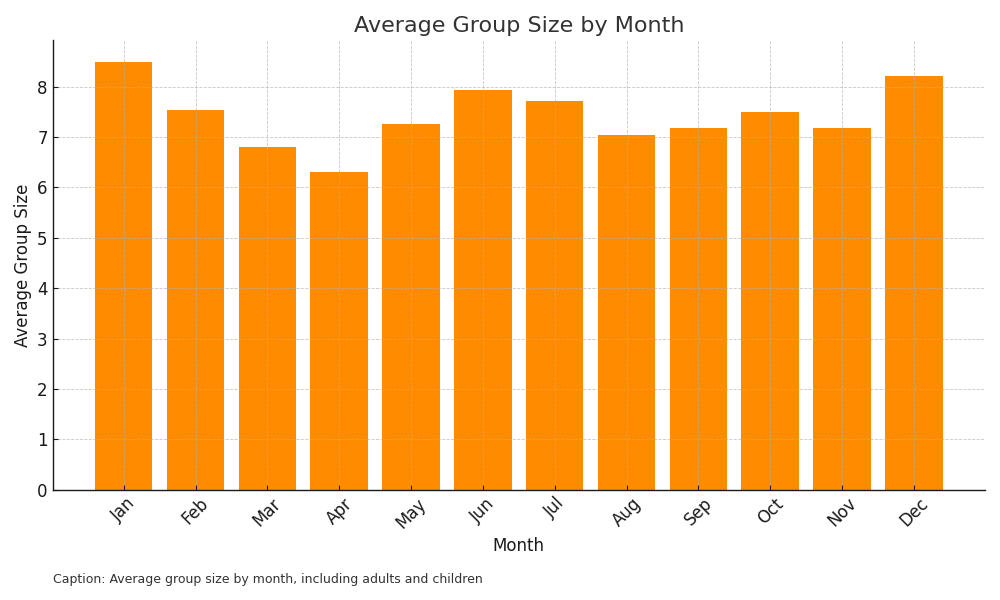
The following analysis focuses on the average group size by month for vacation rentals in the Bahamas. Understanding the group size distribution can aid in tailoring accommodation offerings, pricing strategies, and guest services, as well as insight for tour and activities operators.
Percentage of Inquiries by Month
The subsequent analysis focuses on the distribution of inquiries by month for vacation rentals in the Bahamas. Understanding the monthly distribution of inquiries is vital for strategic planning, marketing efforts, and resource allocation.
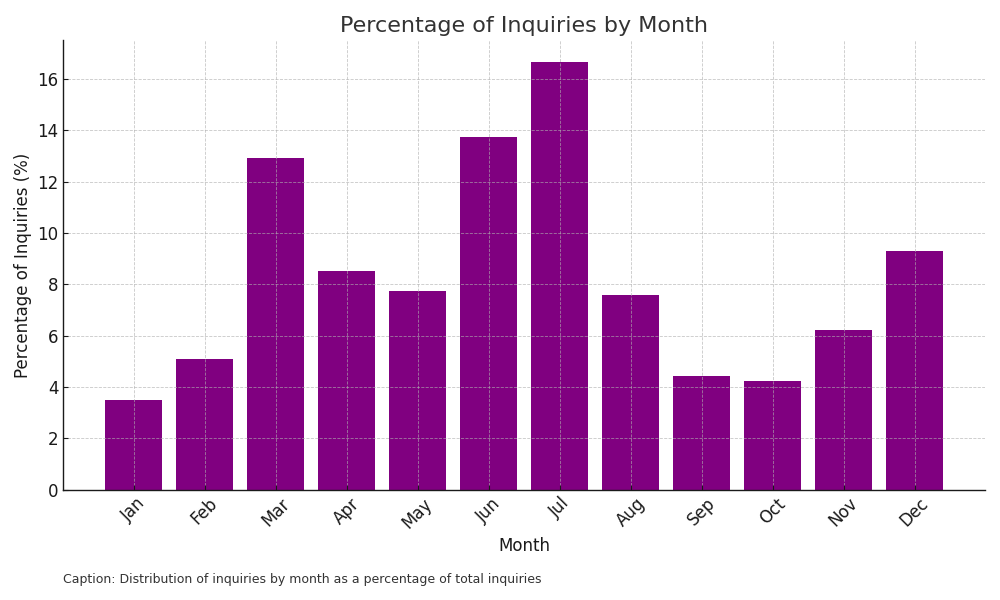
The graph presented above illustrates the percentage of inquiries by month for vacation rentals in the Bahamas. This representation provides an overview of the distribution of inquiries throughout the year.
Understanding the monthly distribution of inquiries enables targeted efforts to enhance guest acquisition and capitalize on market opportunities.
Total Average Group Size (Combining Adults and Children)
The next analysis focuses on the total average group size, which includes both adults and children, for vacation rentals in the Bahamas.
Understanding the average group size can help in customizing accommodation offerings, defining pricing models, and enhancing guest satisfaction.
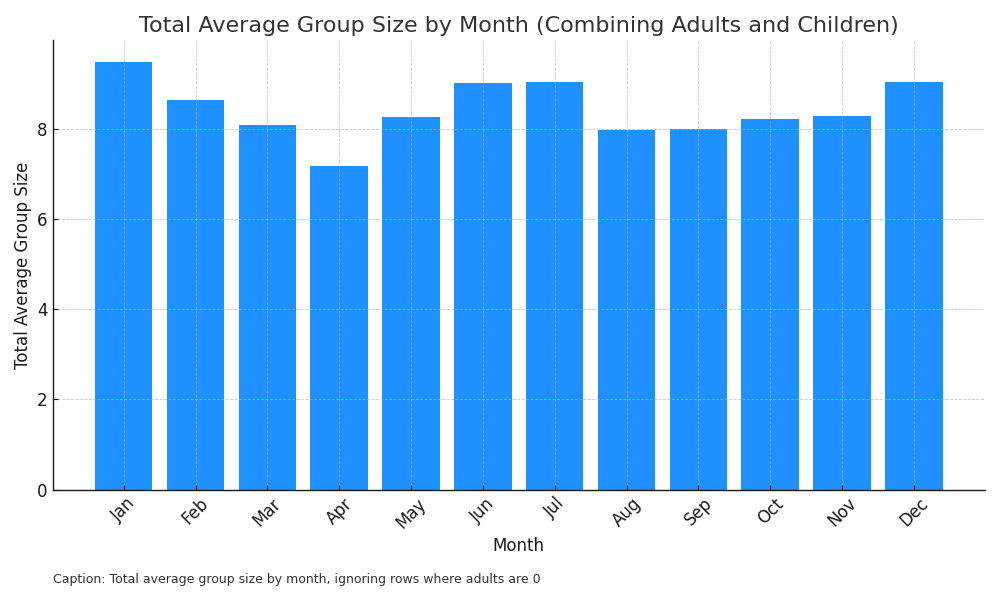
The variations across different months provide insights into the preferences and behavior of families traveling with children by seasonality.
This information is instrumental for stakeholders in tailoring family-friendly offerings, accommodation configurations, and guest services. Understanding the dynamics of family travel enables the creation of targeted packages, promotional campaigns, and amenities that resonate with this specific segment.
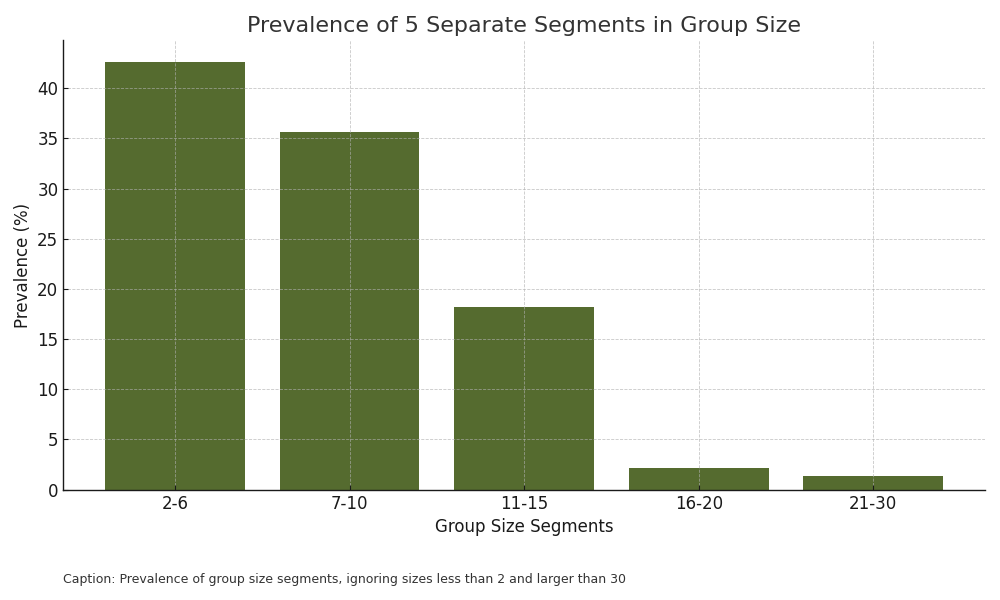
Prevalence of 5 Separate Segments in Group Size
The following analysis explores the prevalence of 5 separate segments in group size for vacation rentals in the Bahamas.
Understanding the distribution of group sizes within specific segments can provide insights into market segmentation, accommodation tailoring, and targeted marketing.
Median and Average Days from Inquiry to Arrival by Month in the Bahamas
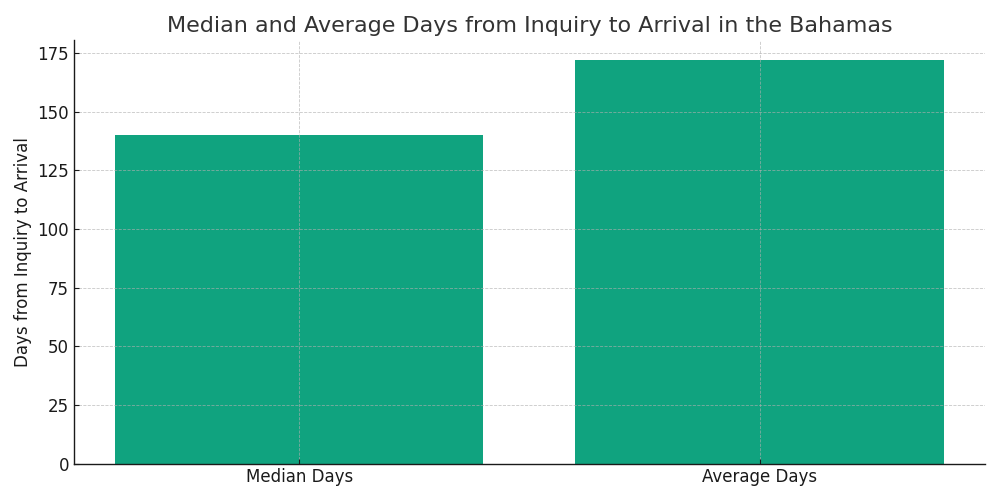
The bar graph above illustrates both the median and average number of days from inquiry to arrival by month for vacation rentals in the Bahamas.
The variations observed in this graph offer insights into the planning behavior of travelers. The median provides a robust measure, while the average captures the overall trend.
Understanding these trends is vital for stakeholders in the travel and hospitality industry. It allows for alignment with travelers’ planning patterns, timely marketing campaigns, inventory management, and the creation of personalized pre-arrival experiences.
Sign up for Future Reports
If you would like to be notified of future travel trend analysis, please fill out this contact form and indicate your preference to receive these updates in the message section.